DrawIO Diagrams for the MSc Digital and Tech course
The reason why my blog has been so quiet this year has been because I began a masters in digital and tech at the University of Northumbria earlier this year and also because ChatGPT came along and sort of ruined my fun a bit. Now most of my ideas for blog posts have become null and void! Anyway, I will persist and change my angle a bit to adapt to this new brave world of AI.
Instead I thought I might share some of my creations! If you are reading this because you are also on the MSc in digital and tech then you have my sincere condolences…
Only kidding! It’s a great course but it has taken a lot out of me this year and I am writing this as I am in the swathes of Covid during Christmas and at the end of a long, long year. I do enjoy the academic writing despite it being twenty years since I last wrote anything vaguely academic. I have learnt so many academic frameworks and tools that are applicable to my line of work and are really helping me manage my workload and to understand how my job role as DevOps engineer came to exist.
So in this article I thought I would share some of the diagrams I have created so far. I will try to keep them generic and feel free to amend them, although if you do use them I would love a credit!
You will find them all at my repo at: https://gitlab.com/mikerossiter/draw-io-diagrams.
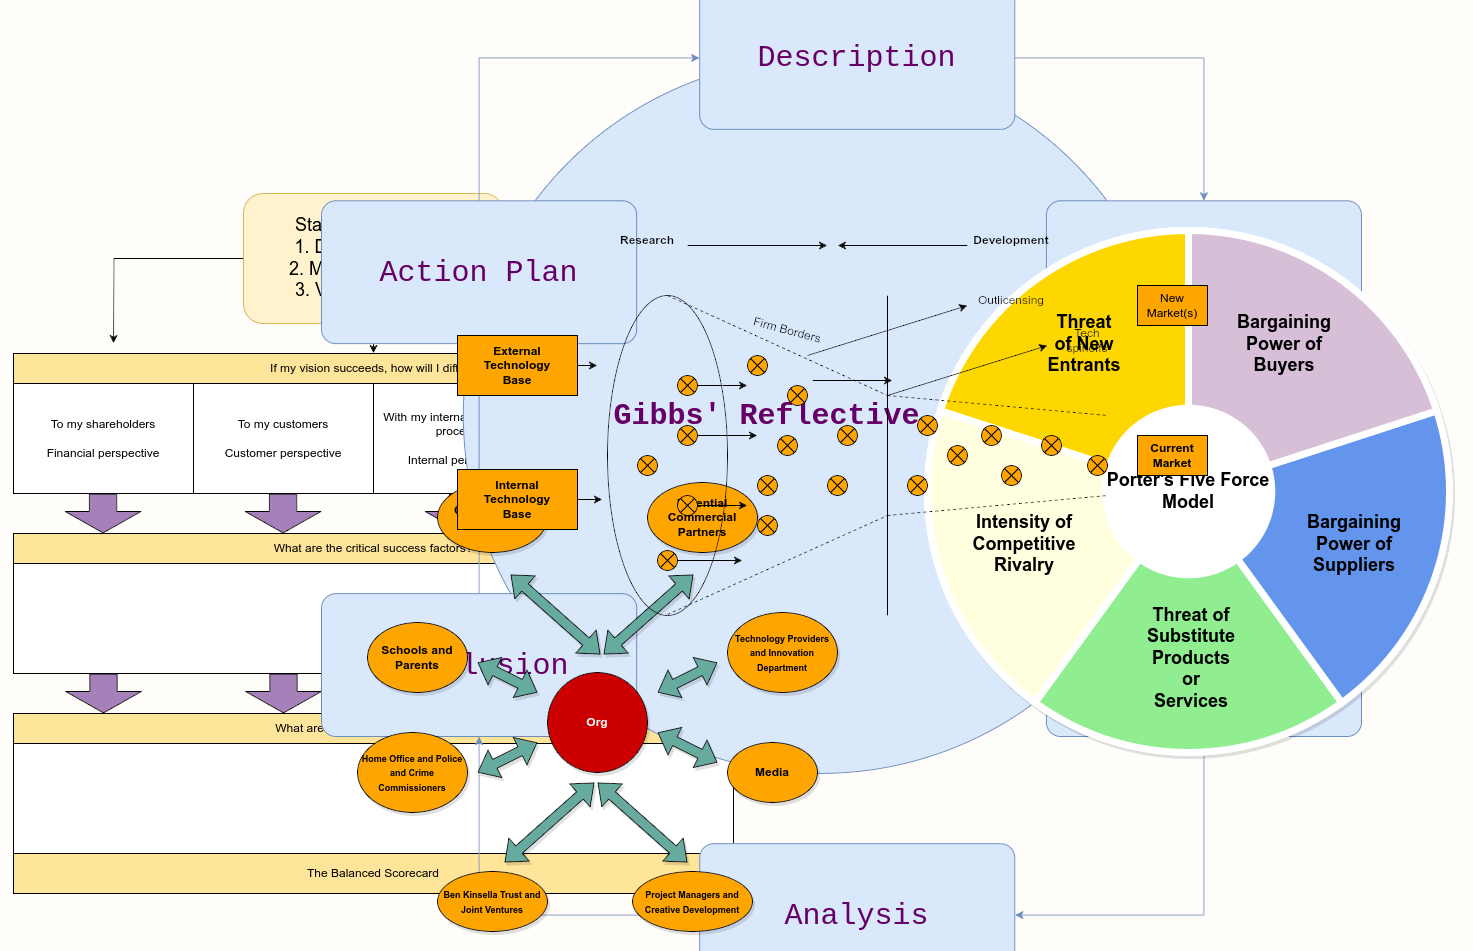
So far I have examples of:
- Gibb’s Reflective Framework
- Porter’s Five Force Model
- Stakeholder Analysis
- Chesborough Open Innovation Funnel
- Basic Balanced Scorecard (Not really a fan of this model but it might be useful to someone. I would edge toward the Agile version of the scorecard as suggested by Agile Strategy Management in the Digital Age by Wiraeus and Creelman)
Most of which are visible in the mashed up header I’ve created!
☕ Enjoyed this post? Buy me a coffee!